matto
New Member

Posts: 3
|
Post by matto on Jan 22, 2019 0:17:00 GMT -5
Hi, I'm extremely new to Basic (and new to forums - this is my first ever!). I wish to read a file containing arrays of floating point binary numbers but i can't work out how to do that in Just Basic. I see there is: open file$ for binary as #hndl
input #hdnl, var but if i understand it correctly, var is only 1 byte? How do i read 4-byte floating point numbers? And what about other binary data types (unsigned short, long integer, etc) I'm kind of lost... ...please help! cheers, MattO
|
|
|
|
Post by Rod on Jan 22, 2019 9:25:07 GMT -5
OK, you are using a lot of computing words but perhaps in the wrong context.
A file usually consists of data items with a data delimiter to signal the end of the data item. You can also get files that contain repetitive similar sized data. Usually a file header explains how it is laid out.
But there is no "array", that is created in your program from the file info.
Everything in computing is binary, numbers are more usually described as integer, float, double etc. So while the file is certainly binary in nature that may not be how the numbers are stored in the file. It may simply be stored as text, like 12345 or it may be stored as four or eight bytes of data that represent the 32 or 64 bits of information describing the number. These latter formats are single or double precision floats.
None of this is in "beginners" territory. Do you have a sample file and know what numbers are meant to be stored? A little more info about the file and where it comes from might help us get to a solution. How do you know it is a four byte float for example?
I don't want to jump to solutions just yet because they might get complex. Liberty BASIC uses 8byte double precision floats internally, there are routines to convert from one type to another but one step at a time.
|
|
matto
New Member
Posts: 3
|
Post by matto on Jan 24, 2019 1:57:15 GMT -5
Hi Rod,
Yes, i see now i'm not being very clear.
I work in Perl (please don't make fun of me for that!), and i am writing arrays of floating point data to a text file using my Perl scripts. I have developed a BAS program which can read in these (ASCII) data and plot them beautifuly in a graphics window. However, it is REALLY SLOW so i thought that if the input data file were in actual binary, it might speed up the inport process. (I believe things like Python read binary data in way faster than ascii, not so?)
So I suppose my question(s) ought to have really been:
1. how can I speed up importing (and then plotting) large amounts of ascii data?
2. will importing it as binary data improve the speed of import?
|
|
|
|
Post by tsh73 on Jan 24, 2019 2:35:26 GMT -5
Sorry LB has no binary data import capabilities.
You can read binary date - whole file or byte-by-byte
- but you'll have to convert each 4(or 8) bytes to number separately.
I really think reading it from ascii file would be faster.
But one could try that.
What is "large amounts"?
How many lines, how much numbers per line (approximately)?
What is "is REALLY SLOW"?
Could you post your input routine (for Ascii file) so we can see/try if that could be sped up?
Is it data import or plotting that is slow?
(LB is not fast by itself, but there is a few tricks for speeding up graphics as well)
|
|
|
|
Post by Rod on Jan 24, 2019 2:41:51 GMT -5
The fastest way to get data into Liberty BASIC is to read in the entire file to a single string. That part will be instantaneous. After that it will slow down a bit. I would just keep writing your data as clear text, bear in mind that we are talking about a thousand pixel positions on screen then you could probably round down the values to a limited number of decimal places. You should add a delimiter in pearl say an * Now load the file to a Liberty string and use the WORD command in conjunction with the * delimiter to work through the string plotting your values.
On my iPad just now but will code an example this morning.
|
|
|
|
Post by Rod on Jan 24, 2019 4:01:39 GMT -5
Some sample code that creates 500 floats and imports them, then charts them. It takes about a second to import and chart 500 items, don't know if this is slow or fast for you.
        'write 500 data items to a test file delimited with "*"
        open "test.dat" for output as #1
        for n= 1 to 500
            degree=degree+1 mod 360
            y=sin(degree/57.29577951)*150
            #1, str$(y)+"*";
        next
        close #1

        t=time$("ms")
        'now import the entire data set to d$
        open "test.dat" for input as #2
        d$=input$(#2,lof(#2))
        close #2

        'now chart it we simply work through d$ a word at a time
        'open our window and graphicsbox and set options and event labels
        'nomainwin
        WindowWidth  = 600
        WindowHeight = 600
        UpperLeftX   = (DisplayWidth-WindowWidth)/2
        UpperLeftY   = (DisplayHeight-WindowHeight)/2
        graphicbox #1.g, 50,80,500,300
        open "Chart" for window_nf as #1
        #1 "trapclose [Quit]"
        #1.g  "down"

        'fancy shaded graphics you could equally down ; fill black
        for shade= 300 to 0 step -2
        print #1.g, "color ";shade/2+100;" ";shade/2+100;" ";shade/2+100
        print #1.g, "line 0 ";shade;" ";"500 ";shade
        print #1.g, "line 0 ";shade-1;" ";"500 ";shade-1
        next shade
        print #1.g, "color yellow"
        print #1.g, "line 0 150 500 150"
        print "Time to import data and set up for drawing :";time$("ms")-t
        t=time$("ms")
        'draw the chart
        #1.g "color red"
        for n=1 to 500
            #1.g "set ";n;" ";val(word$(d$,n,"*"))+150 'set 0 at mid chart
        next n
        #1.g "flush"
        print "Time to string slice and draw the chart itself: ";time$("ms")-t
        wait


        [Quit]
        close #1

        end
|
|
|
|
Post by tsh73 on Jan 24, 2019 4:14:19 GMT -5
Here's program that writes 100 000 pairs of numbers
and then reads them into array.
Isn't that fast enough?
Output
Writing file, 100000 number pairs
Time taken, ms              ms per line
3659          0.03659
Press ENTER
Reading file, 100000 number pairs
Time taken, ms              ms per line
5263          0.05263
*over*
Program
N=100000
dim x(N), y(N)
Print "Writing file, ";N;" number pairs"
'goto [read]

t0=time$("ms")
open "data.txt" for output as #1

for i = 1 to N
    print #1, rnd(1)*1000
    print #1, rnd(1)*1000
next
close #1
t1=time$("ms")
print "Time taken, ms", "ms per line"
print t1-t0, (t1-t0)/N

input "Press ENTER"; dummy$

Print "Reading file, ";N;" number pairs"
t0=time$("ms")
open "data.txt" for input as #1
for i = 1 to N
    'input #1, x,y
    input #1, x(i),y(i)
    'print i, x, y
next
close #1
t1=time$("ms")
print "Time taken, ms", "ms per line"
print t1-t0, (t1-t0)/N

print "*over*"
|
|
|
|
Post by tsh73 on Jan 24, 2019 4:21:05 GMT -5
Rod, reading long string and parsing it just don't pay
result of code with (reading long string and parsing it)
Time to import data and set up for drawing :57
Time to string slice and draw the chart itself: 870
result of code with (writes/reads single number per line)
Time to import data and set up for drawing :65
Time to string slice and draw the chart itself: 51
code modified to write/read single number per line
 'write 500 data items to a test file delimited with "*"
        open "test.dat" for output as #1
        for n= 1 to 500
            degree=degree+1 mod 360
            y=sin(degree/57.29577951)*150
            #1, str$(y)'+"*";
        next
        close #1

        t=time$("ms")
        'now import the entire data set to d$
        open "test.dat" for input as #2
        'd$=input$(#2,lof(#2))
        dim d(500)
        for i = 1 to 500
            input #2, d(i)
        next
        close #2

        'now chart it we simply work through d$ a word at a time
        'open our window and graphicsbox and set options and event labels
        'nomainwin
        WindowWidth  = 600
        WindowHeight = 600
        UpperLeftX   = (DisplayWidth-WindowWidth)/2
        UpperLeftY   = (DisplayHeight-WindowHeight)/2
        graphicbox #1.g, 50,80,500,300
        open "Chart" for window_nf as #1
        #1 "trapclose [Quit]"
        #1.g  "down"

        'fancy shaded graphics you could equally down ; fill black
        for shade= 300 to 0 step -2
        print #1.g, "color ";shade/2+100;" ";shade/2+100;" ";shade/2+100
        print #1.g, "line 0 ";shade;" ";"500 ";shade
        print #1.g, "line 0 ";shade-1;" ";"500 ";shade-1
        next shade
        print #1.g, "color yellow"
        print #1.g, "line 0 150 500 150"
        print "Time to import data and set up for drawing :";time$("ms")-t
        t=time$("ms")
        'draw the chart
        #1.g "color red"
        for n=1 to 500
            '#1.g "set ";n;" ";val(word$(d$,n,"*"))+150 'set 0 at mid chart
            #1.g "set ";n;" ";d(n)+150 'set 0 at mid chart
        next n
        #1.g "flush"
        print "Time to string slice and draw the chart itself: ";time$("ms")-t
        wait


        [Quit]
        close #1

        end
|
|
|
|
Post by Rod on Jan 24, 2019 7:50:10 GMT -5
Indeed much faster, the thing that's confusing me is with this low volume of data how can it ever be "slow". I was expecting much more data and much more processing. But the OP will need to tell us what large and huge means.
|
|
matto
New Member
Posts: 3
|
Post by matto on Jan 24, 2019 21:43:35 GMT -5
Hi guys, It looks like you awesome people have given me plenty of things to think about! And some great examples to try. Just quickly though, the data are seismic data so my files contain 100's of records where each record begins with some survey information (line#, sample#, GPS lcoation, some stats, etc.) followed by 3 arrays of 500 values each: the first array is a set of frequencies while the following two arrays are seismic data (i.e. real numbers). I then plot the two seismic arrays against the frequency array to produce a pretty picture. Here is an examlpe of the kind of output I'm trying to acheive: 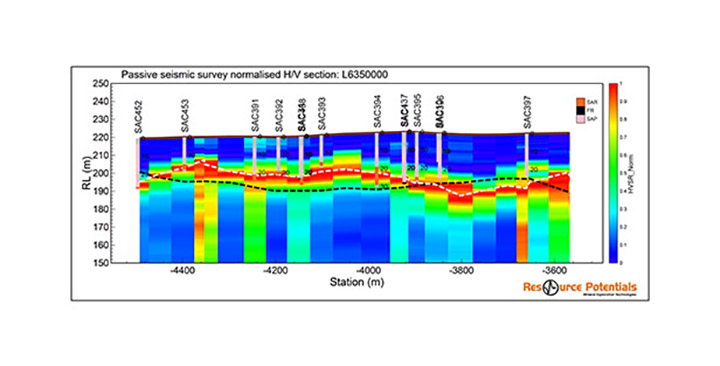 . However this is just my "test dataset", I really want each of three arrays to be the full 2048 in length. I apologise if this doens't sound like "huge" amounts of data! Anyway, I'll have a play with your examples over the weekend. Maybe it's my rendering which is poorly manage? I'll have some idea after I've had a go with your excellent examples. Thank you everyone! |
|
|
|
Post by tsh73 on Jan 24, 2019 23:42:38 GMT -5
so is it
(2048 freq + 2*2048 seismic array data)
numbers to read/plot, or
(100 records)*(2048 freq + 2*2048 seismic array data)?
Yes drawing picture with points is slow in JB.
With color constantly changing even more slow.
How you define point color by (freq, array1, array2)?
|
|
|
|
Post by Rod on Jan 25, 2019 5:47:20 GMT -5
I am pretty confused. I can see that the frequency is color mapped in columns. How many columns along the x axis? 100 or 2048? But if you are drawing this column how many pixels do you plan to color in the y axis? if you have 2048 values do you intend to draw a column 2048 pixels high?
As for the other two sets of 2048 data I really cant see where or how they are applied to the chart.
My thoughts are that you need to average and rationalise the data to match the drawn chart size. That way you can avoid potentially 8589934592 computations which is where the slowdown is coming from.
To get the best help you should consider posting example datasets and the code you have written to draw the chart.
|
|
|
|
Post by tenochtitlanuk on Jan 27, 2019 19:28:48 GMT -5
This image,1024x512, was generated in about 3 minutes. I'm prepared to wait that kind of time- grab a coffee or similar. I reckon even reading your data rather than generating the pixels would take similar speed. 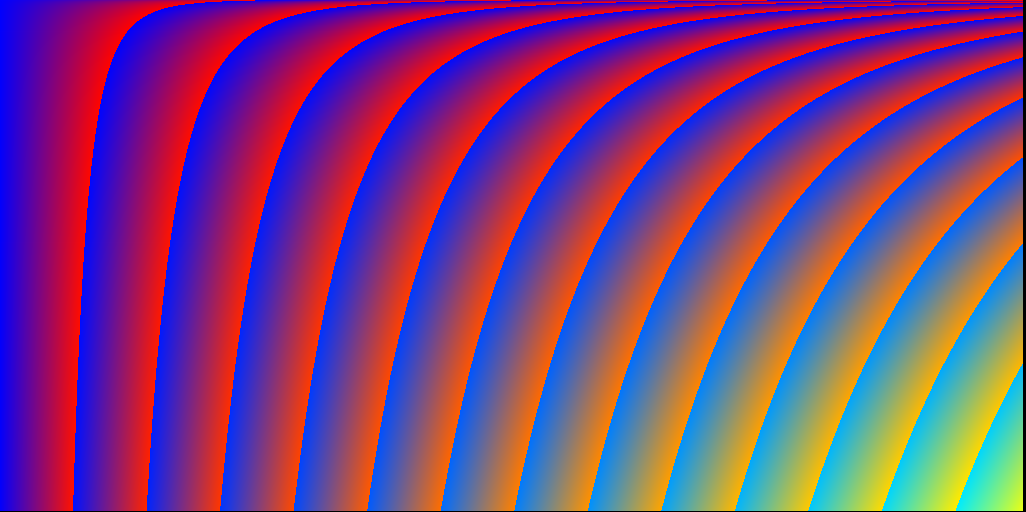 If you really need 2048x2048 images it would take 8 times as long, of course. Perhaps relevant is that once image size exceeds your screen display, or an internal JB/LB limit, I find that my ( Linux) setup crashes. And getbmp may fail.. I generate these large images by writing the data straight to a 24 bit BMP file. I can supply code on my website if you are interested. |
|
|
|
Post by Rod on Jan 28, 2019 2:56:22 GMT -5
John is correct in saying that you cannot getbmp anything you cannot see on screen. But, you can draw huge images and you can print those images. drawing to a small graphicbox I can draw an image 2048*2048 and print that image. #1.gb “print “;2048 will print the image full page width. A modern printer copes with that. You can also scroll the image in the small graphicbox, so you are not limited to your screen display size for printed. Images.
On the LBPE there is an example printing a 5000 pixel image.
Time to draw remains an issue if you must color every pixel.
|
|


