|
|
Post by tenochtitlanuk on Jan 22, 2021 15:44:37 GMT -5
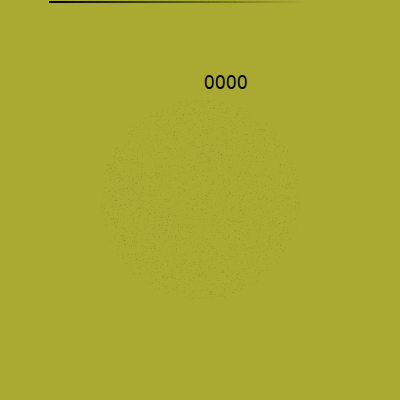
'fraid I can't emulate the on-line one at sand pile emulationAs the image below shows, even with 16384 ( 2^14) grains I exceed 2000 seconds. The link above goes to 2^30!! 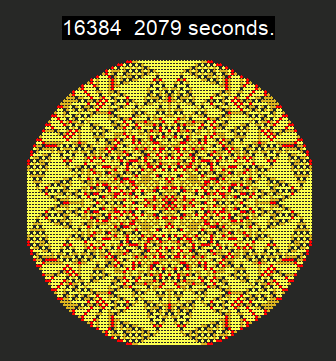 I recommend the version I wrote that shows the behaviour in real time- but realistically only on less than 2^8 sites. You see this wriggling Brownian motion like apparently randomly collapsing pillars of sand, yet creating increasingly distinct symmetry patterns. |
|
|
|
Post by tenochtitlanuk on Jan 21, 2021 17:40:10 GMT -5
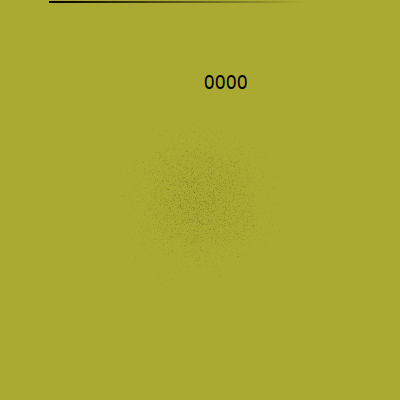
I've been having fun with simulating the arrival of sand/paint in various distributions, and the self-organising patterns you get when piled-up sand keeps avalanching away from the source. This is a suggested task on Rosetta Code- ..and the 'sandpiles'.... Anyway, I think the graphics are pretty, and it was fun to see ways to speed production.. Following is a link to a page on my site about this, with code |
|
|
|
Post by tenochtitlanuk on Jan 17, 2021 12:21:05 GMT -5
Works a treat, Thanks Jordi! ¡Muy bien hecho!
I've never got the LB native editor to print from LB in Linux- every symbol prints in black on a black backgound!
PS Your 3D work looks fun....
|
|
|
|
Post by tenochtitlanuk on Jan 7, 2021 16:32:46 GMT -5
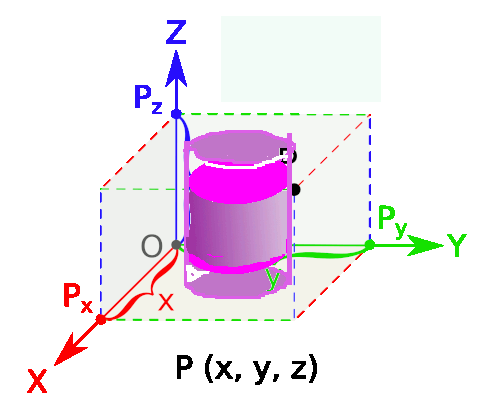
Thanks for the helpful comments, Anatoly! I was aware of most of these aspects. The code is from some years back, and as I commented I've experimented with many versions. Certainly saving as a string is extravagant on space. I too have written straight to bmp files, but stumble when I want to set points bigger than one pixel. It's been fun and I'll keep playing! Really, I was wondering what occasions people have NEEDED more than two dimensions.. I think my record was the 'Pi in ten dimensions' stuff i played with. Anyway- here's a higher resolution set of images, and the times on my unimproved code! Truncated circular conic pyramid, with density variations.  -  -  153 seconds to generate 3D array
775 seconds to display all Z-layers of 3D array
1461 seconds to display all X layers of 3D array
2192 seconds to display all Y-layers of 3D array |
|
|
|
Post by tenochtitlanuk on Jan 7, 2021 11:17:52 GMT -5
Several times OPs have asked about higher-than-2D arrays in LB.
I'd be interested in any code in this area that people have used/needed.
I've just added a new page on my LB site giving an example from my files, adding to the existing page.
Scans through 3D objects, showing slices perpendicular to the main axes...
|
|
|
|
Post by tenochtitlanuk on Jan 3, 2021 17:01:49 GMT -5
If I'm at a loss for something to code, Rosetta Code often suggests something I haven't seen coded in LB.
Peano curves connect two points via longer and longer routes which occupy an increasing fraction of the points in a region but never cross. In the case RC specifies, they will- 'at infinity'- have visited every point in a square region. Along the way they create an interesting pattern. But as they fill more and more of the square it gets boringly monochrome, so I added a colourful twist...
|
|
|
|
Post by tenochtitlanuk on Jan 2, 2021 15:53:39 GMT -5
Ernie- can you post the whole section from the RTF that represents the image, and tell us its width and height? The data seems saved as pure ASCII, so it takes two bytes to specify a bit value that can go over 127 thru' 255. eg '89504e470' seems to mean x89, x 50, etc.. or am I wildly off course? When I saved a RTF with a 10x10 bmp embedded it seemed to take 418 bytes?  |
|
|
|
Post by tenochtitlanuk on Jan 2, 2021 11:15:05 GMT -5
I wonder if RTF is the way to go? You do ask for suggestions... Wikipedia says.. [i]RTF is a proprietary document file format with published specification developed by Microsoft Corporation from 1987 until 2008 for cross-platform document interchange with Microsoft products.[/i]If the aim is for users to PRINT output including greyscale graphics and perhaps test, that's easy directly from LB. If you want to create a document that can be saved and passed on, PDF is a much better way IMHO. The code following will print text +graphics, OR if you have printing to PDF as default will create a saved document that can be worked on by almost any word processor... The code below prints a page of text/graphics. See 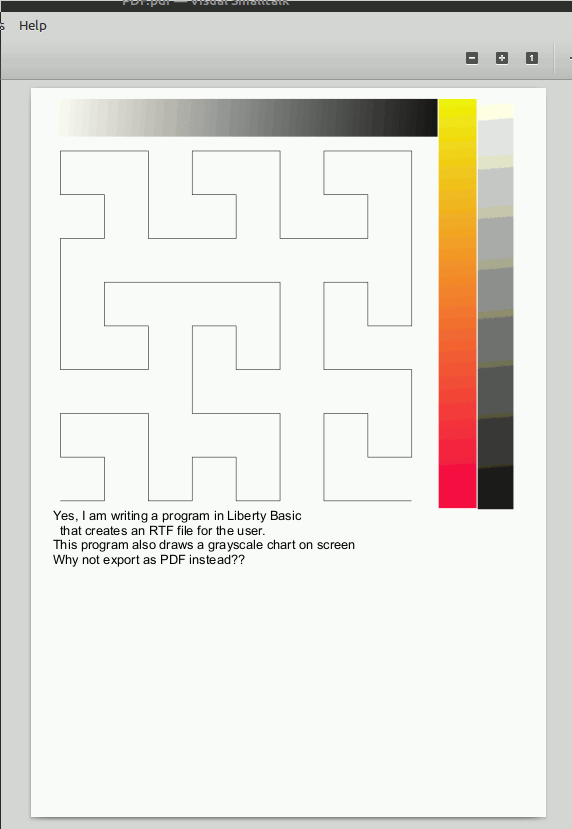
nomainwin

WindowWidth  = 950
WindowHeight =1080


open "Peano curve RC" for graphics_nsb as #wg

#wg "trapclose quit"

loadbmp "scr", "Peano4b.bmp"   'replace with your BMP or add code to draw your bar chart etc...
#wg "down ; drawbmp scr 50 20"

#wg "up ; goto 40 800 ; font 18"
#wg "\" +"Yes, I am writing a program in Liberty Basic"     +chr$( 13) +_
"  that creates an RTF file for the user."                  +chr$( 13) +_
"This program also draws a grayscale chart on screen"       +chr$( 13) +_
"Why not export as PDF instead??"

#wg "flush ; print 950"


wait

sub quit h$
    close #wg
    end
end sub
|
|
|
|
Post by tenochtitlanuk on Dec 31, 2020 7:29:15 GMT -5
... and another version. Languages of LB friends... or as near as LB4 allows... including an image of a ( much) younger me! May 2021 be a kinder year for us all!  |
|
|
|
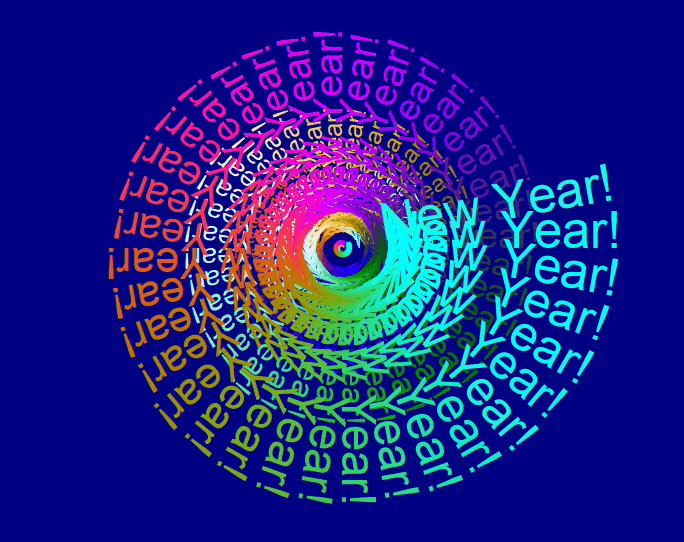
Post by tenochtitlanuk on Dec 29, 2020 17:17:34 GMT -5
Anatoly and I have been showing JB-ers how to rotate text +-90 degrees by BMP manipulation. I like to post something graphic and cheerful at this time of year, so here is a demo of how easy it is to rotate by any angle in LB... we all need cheering in this time of COVID. Take out the delay for a nice visual rush...
    nomainwin

    global angle

    WindowWidth  =800
    WindowHeight =800

    open "test" for graphics_nsb as #mg

    #mg "trapclose [quit]"

    hw      = hwnd( #mg)

    calldll #user32, "GetDC", hw as ulong, hdc as ulong

    calldll #gdi32, "SetBkMode", hdc as long, 1 As long, result As long

    #mg "home ; fill darkblue ; color cyan ; backcolor darkblue"
    #mg "fill darkblue ; color cyan ; backcolor darkblue"


    weight      =  0    '   how much to emphasize /widen the strokes
    height      = 20    '   how big to make font ?in pixels?
    t           =500

    for angle =0 to 3 *3600 +100 step 100'   rotates in degrees/10 about bottom left-hand of character bounding box

        height =height *1.01               '  progressively reduce font size
        H      =int( height)

        calldll #gdi32, "CreateFontA",_
                         H as long,           0 as long,_
                         angle  as long, angle  as long,_
                         weight as long,_
                                  0 as long, 0 as long, 0 as long, 0 as long, 0 as long, 0 as long, 0 as long, 0 as long,_
                                  "Arial" as ptr,_
                         hfont as ulong

        calldll #gdi32, "SelectObject", hdc as ulong, hfont as ulong, oldhfont as ulong

        #mg "color "; col$()
        #mg "place "; 300 +230 *sinR( t +deg); " "; 500 +230 *cosR( t +deg)
        #mg "\.  New Year!"


        timer 100, [p]
        wait
        [p]
        timer 0

    next angle

    #mg "getbmp scr 0 0 800 800"
    bmpsave "scr", "greetings.bmp"

    wait

    function col$() '   graduated colour cycling
        red     =int( 128 +127 *sin( angle /607))
        grn     =int( 128 +127 *cos( angle /845))
        blu     =int( 128 +127 *cos( angle /423))
        col$ =str$( red) +" " +str$( grn) +" " +str$( blu)
    end function

    function cosR( t): cosR =cos( t *3.14159265 /180): end function

    function sinR( t): sinR =sin( t *3.14159265 /180): end function

[quit]
    calldll #user32, "ReleaseDC", hWnd as long, hdc as long, result as long
    close #mg
    end
PS This version is one of several and is a serendipitous result of a misunderstanding of the call/release! But Hey Ho- result looks good.
|
|
|
|
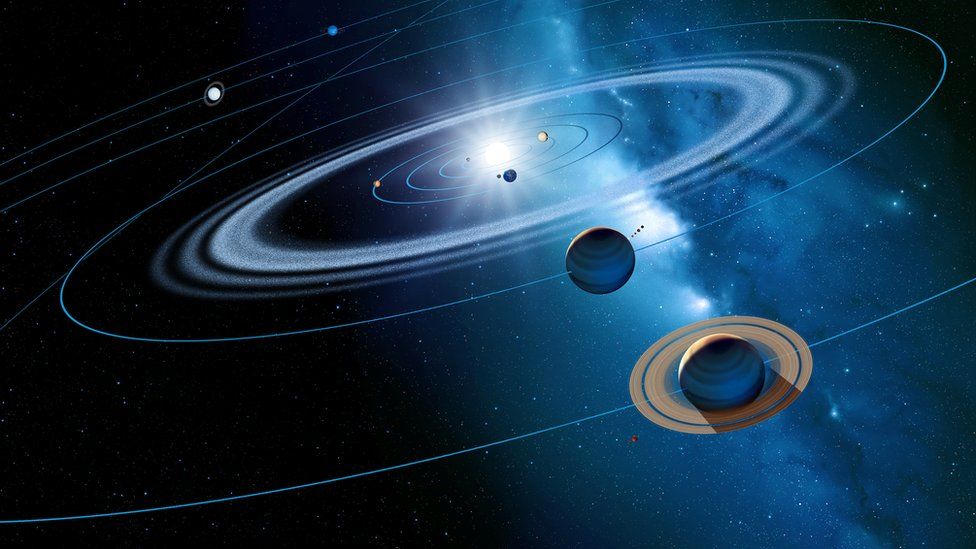
Post by tenochtitlanuk on Dec 22, 2020 8:07:33 GMT -5
Season's Greetings to all my on-line LB friends...
I was very annoyed by two things about the present conjunction of Jupiter and Saturn.
First, the weather in the UK has not allowed viewing it ( surprise!)
Secondly, the BBC used this image. Artistic, perhaps, but totally wrong scientifically. Wouldn't mind the scaling distortion- you can't avoid that! But the Earth has to be on the other side of the Sun!
Anyway, it pushed me this morning to do an LB 'orrery' to show planetary paths to scale. Image animates the start ( with all planets aligned) and steps into the future before another snap 1 earth year later..
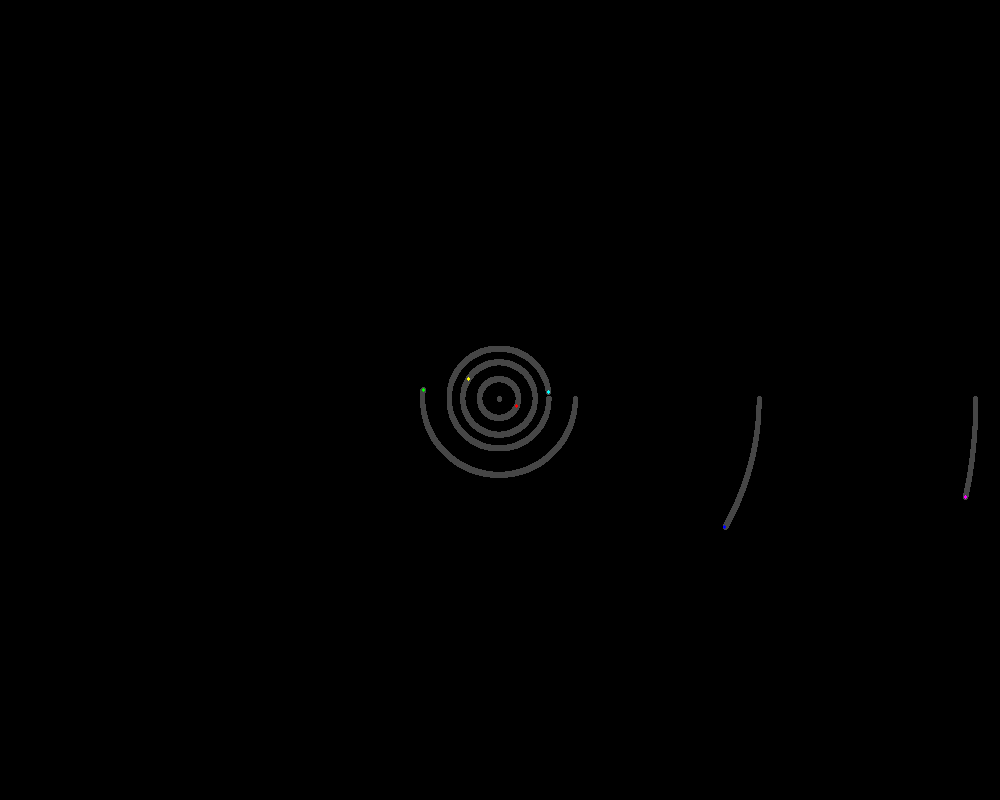
    '     name,      period in days, radius in AU
    data "Mercury",      87.97,        0.387
    data "Venus",       224.70,        0.7233
    data "Earth",       365.26,        1.0000
    data "Mars",        686.98,        1.5273
    data "Jupiter",    4332.82,        5.2028
    data "Saturn",    10755.70,        9.5388
    data "Uranus",    30687.15,       19.1914
    data "Neptune",   60190.03,       30.0611

    for i =1 to 8
        read in$: planet$( i)   =in$
        read in:  period(  i)   =in
        read in:  radius(  i)   =in
        angle( i)               =0
    next i

    global scaleInnerOnly
    scaleInnerOnly =50

    nomainwin

    WindowWidth  =1010
    WindowHeight = 840

    open "Solar System" for graphics_nsb as #wg

    #wg "trapclose quit"
    #wg "down ; fill black"

    #wg "size 5 ; color yellow ; set 500 400 ; size 2 ; flush"

do
    for i =1 to 8
        call orbit i
    next i
    scan
loop until 1 =2

    wait

    sub orbit i 'planet$, period, radius
        xS          =int( 500 +radius( i) *scaleInnerOnly *cos( angle( i)))
        yS          =int( 400 +radius( i) *scaleInnerOnly *sin( angle( i)))
        angle( i)   =angle( i) +0.0005 *( radius( 3) /radius( i))^( 3 /2) '   Kepler Third Law
        #wg " color 70 70 70 ; size 5"
        #wg "set "; oldPos$( i)
        #wg "color "; word$( "red yellow cyan green blue pink lightgray white", i)
        #wg "size 3 ; set "; xS; " "; yS
        oldPos$( i) =str$( xS) +" " +str$( yS)
    end sub

    sub quit h$
        #wg "getbmp scr 1 1 1000 800"
        bmpsave "scr", "action2.bmp"
        close #wg
        end
    end sub
 |
|
|
|
Post by tenochtitlanuk on Dec 17, 2020 9:00:47 GMT -5
Rod and I both use these ways to handle fast pixel changes. I'd just point out that the need to calculate the pointer offset to the data triplets is removed if any bitmap BMP you wish to LOAD has been saved as 24 bit, has no colour table, and has width a multiple of 4. The pointer to a triplet is then directly to '54 +3 *x +y *width'.
You might also consider using a timer to save the array as a bmp and reload and display on screen. Between times, get on with the other calculations..
This sounds like a fun project...
|
|
|
|
Post by tenochtitlanuk on Dec 17, 2020 8:51:10 GMT -5
You don't say WHAT does not work. My code does!
Is it the putting into arrays that's troublesome? Try the code below. It stores 100 records in arrays and recalls them at random...
Are you having trouble distinguishing numeric and string variables? Say so in that case!
Are you using Linux for creating files, or to run LB? If so, be aware of the different line endings..
naam$ = "Elibertest.txt"

open naam$ for input as #fIn


dim entry( 1000)   '   assume you'll have fewer records than this..
dim dat$(  1000) '  data is a reserved word!
dim tim$(  1000) ' time too...
dim temp$( 1000)

i  =1

while eof( #fIn) =0
   line input #fIn, row$

   e$            =word$( row$, 1, " ")
   entry( i)     =val( e$)

   dat$          =word$( row$, 2, " ")
   dat$( i)      =dat$

   tim$          =word$( row$, 3, " ")
   tim$( i)      =tim$

   temp$         =word$( row$, 4, " ")
   temp$( i    ) =temp$

   '    print "Record #"; tab( 8); entry$, dat$, tim$, word$( temp$, 1, ",") +"." +word$( temp$, 2, ",") +" ºCelsius"
   i =i +1
wend

close #fIn

print "  Record #     date       time    temp"

for i =1 to 10
    record =int( 100 *rnd( 1))  '   choose one of the saved records at random...
    print entry( record), dat$( record), tim$( record), temp$( record)
next i

end
|
|
|
|
Post by tenochtitlanuk on Dec 15, 2020 11:44:25 GMT -5
|
|
|
|
Post by tenochtitlanuk on Dec 14, 2020 16:51:45 GMT -5
Try this. I just printed data from each line. 'word$' is a very useful function!
In the UK we use a decimal point rather than a comma in temperatures, so I added the conversion!
Are you goung to store these in an array? Be aware that ALL are still string variables. You'll need some lines to turn '16.7' into the number 16.7.
naam$ = "Elibertest.txt"

open naam$ for input as #fIn

while eof( #fIn) =0
   line input #fIn, row$
   entry$ =word$( row$, 1, " ")
   date$  =word$( row$, 2, " ")
   time$  =word$( row$, 3, " ")
   temp$  =word$( row$, 4, " ")
   print "Record #"; tab( 8); entry$, date$, time$, word$( temp$, 1, ",") +"." +word$( temp$, 2, ",") +" ºCelsius"
wend

close #fIn

end
|
|