|
|
Post by tenochtitlanuk on Sept 9, 2018 3:54:28 GMT -5
A large part of my LB output has involved graphical output, where I value its ability to customise numerical calculations and output graphics beyond what I can easily do in Excel/LibreOffice. I haven't written general-purpose code, but each adapts existing examples. See my web site. diga.me.uk for examples- there are lsn files on general graphing, and a page on each of my many projects... most recently the one on radioactive decay and dating, where I generated both simulations of 2D decay of isotope A to B to C, and also the resulting population graphs. ( see on this forum) I think Carl is thinking along lines of producing generalised graphing functions or subroutines to generate scaled axes with plotted data, grids, annotations- but forum readers may find my code suggests what can be done. |
|
|
|
Post by Rod on Sept 9, 2018 6:18:50 GMT -5
There are many approaches that might be taken. I have a fundamental question about whether the data drives the chart sizing or whether the user drives the sizing and the data fits or gets clipped. The code I post is very buggy and just shows some of the issues to consider. The code analyses the data and gets min max values to set the scale. But the chart size is set by the programmer and so too the range to be charted. It would probably be better if the function first analysed the data and then gave recommendations on the size of the chart, they might be overridden by the user who could choose a subset and a min max they prefer. Also I need to find a way to allow more than one chart on display.
nomainwin

    'set up some dummy x,y data in a points() array
    dim points(2,500)
    for n= 1 to 500
        degree=degree+1
        if degree>359 then degree=0
        y=sin(degree/57.29577951)*300
        points(1,n)=n 'x
        points(2,n)=y 'y
    next


    'specify our charts screen position and size
    width=400
    height=400
    x=(DisplayWidth-width)/2
    y=(DisplayHeight-height)/2

    'specify our charts X data range
    'in this example I chart the whole set but could equally chart a subset
    xstart=0
    xend=500

    'now call the generic charting function
    ret=chart(x,y,width,height,xstart,xend)

    timer 5000,[chart2]
    wait

    [chart2]
    timer 0
    close #1
    width=800
    height=200
    'now call the generic charting function
    ret=chart(x,y,width,height,xstart,xend)

    wait


    function chart(x,y,w,h,s,e)

        ' add a margin of 80 pixels to width and height
        ' and open a graphicbox at the desired x,y location
        WindowWidth  = w+80
        WindowHeight = h+80
        UpperLeftX   = x
        UpperLeftY   = y
        open "Graph" for graphics_nf_nsb as #1
        #1 "down ; trapclose [quit] ; font consolas 8"


        ' draw a shaded background the chart starts at 40,10 to allow for x and y
        ' scale values to be printed. For the shading we find y increment in color
        ' value from  128 to 256 so 128 shades and we find what increment per pixel
        ' line is required to give us 128 shades of color
        cx=40
        cy=10
        incc=0-128/h
        #1 "place ";cx-1;" ";cy-1;" ;box ";cx+w+2;" ";cy+h+2
        for y=h to 1 step -1
            #1 "color ";y*incc+256;" ";y*incc+256;" ";y*incc+256
            #1 "line ";cx;" ";cy+y;" ";cx+w+1;" ";cy+y
        next y

        ' how many points to chart
        nopoints=e-s

        ' find scale min and max
        minx=points(1,s)
        maxx=points(1,s)
        miny=points(2,s)
        maxy=points(2,s)
        for n= s to e
            if minx>points(1,n) then minx=points(1,n)
            if maxx<points(1,n) then maxx=points(1,n)
            if miny>points(2,n) then miny=points(2,n)
            if maxy<points(2,n) then maxy=points(2,n)
        next

        'calculate scale increase per pixel line
        'write text every 20 pixels
        'set mid point as 0,0 initially
        mx=0
        my=0
        incx=(maxx-minx)/w
        incy=(maxy-miny)/h

        'now draw the Y scale
        for y=h to 0 step -20
            s$=str$(int(maxy-y*incy))
            if left$(s$,1)="-"then
                s$=right$(s$,len(s$)-1)
                #1 "color red"
            else
                #1 "color black"
            end if
            sx=len(s$)*6
            'at the mid point draw an axis line
            if int(maxy-y*incy)>-1 and int(maxy-y*incy)<1 then
                #1 "place ";cx;" ";cy+y;" ;color yellow ; turn 90 ; go ";w
                #1 "color black"
                my=y
            end if
            #1 "place ";cx-sx-5;" ";cy+y+5;" ;\";s$
        next

        'now draw the X scale
        for x=0 to w step 20
            s$=str$(int(minx+x*incx))
            if left$(s$,1)="-"then
                s$=right$(s$,len(s$)-1)
                #1 "color red"
            else
                #1 "color black"
            end if
            if int(minx+x*incx)>-1 and int(minx+x*incx)<1 then
                #1 "place ";cx+x;" ";cy+h;" ;color yellow ; north ; go ";h
                #1 "color black"
                mx=x
            end if
            for l=1 to len(s$)
                #1 "place ";cx-8+x+l*6;" ";cy+5+h+l*8;" ;\";mid$(s$,l,1)
            next
        next

        'chart the actual data
        #1 "color blue"
        for n=s to e
            #1 "set ";cx+mx+points(1,n)/incx;" ";cy+my+points(2,n)/incy
        next


        #1 "flush"

        end function


        [quit]

        close #1

        end
|
|
|
|
Post by Rod on Sept 10, 2018 3:44:23 GMT -5
This is probably a neater example of the concept. The user states the chart size in pixels and the scale that that represents. The function draws the chart and scale text then plots the data to that scale. It is all driven by the increment per pixel line value calculated from the scale max min and number of pixels. max-min/pixels gives scale increment per pixel line.
nomainwin

    'set up some dummy x,y data in a points() array
    dim points(2,500)
    for n= 1 to 500
        degree=degree+1
        if degree>359 then degree=0
        y=sin(degree/57.29577951)*300
        x=cos(degree/57.29577951)*300
        points(1,n)=x+300 'x
        points(2,n)=y+300 'y
    next


    'specify our charts screen position and size
    width=400
    height=400
    x=(DisplayWidth-width)/2
    y=(DisplayHeight-height)/2
    xmin=-300
    xmax=300
    ymin=-300
    ymax=300
    pmin=0
    pmax=500


    'x,y is graphicbox position on screen
    'width and height is desired chart size
    'space for scale text adds 80 pixels
    'xmin xmax are x scale min and max
    'ymin ymax are y scale min and max
    'pmin pmax are the start and end points
    'in the points() array


    ret=chart(x,y,width,height,xmin,xmax,ymin,ymax,pmin,pmax)
    wait


    function chart(x,y,w,h,xmin,xmax,ymin,ymax,pmin,pmax)

        ' add a margin of 80 pixels to width and height
        ' and open a graphicbox at the desired x,y location
        WindowWidth  = w+80
        WindowHeight = h+80
        UpperLeftX   = x
        UpperLeftY   = y
        open "Graph" for graphics_nf_nsb as #1
        #1 "down ; trapclose [quit] ; font consolas 8"


        ' draw a shaded background surrounded by scale text
        ' for the shading we find y increment in color value
        ' from 128 to 256, so 128 shades and we find what
        ' increment per pixel line is required to give us 128
        cx=40
        cy=10
        incc=0-128/h
        #1 "place ";cx-1;" ";cy-1;" ;box ";cx+w+2;" ";cy+h+2
        for y=h to 1 step -1
            #1 "color ";y*incc+256;" ";y*incc+256;" ";y*incc+256
            #1 "line ";cx;" ";cy+y;" ";cx+w+1;" ";cy+y
        next y

        ' how many points to chart
        ' consider if there are more points than pixels, average?
        nopoints=pmax-pmin


        'calculate scale increase per pixel line
        'write x and y text every 20 pixels
        incx=(xmax-xmin)/w
        incy=(ymax-ymin)/h

        'now draw the y scale
        for y=h to 0 step -20
            s$=str$(int(ymax-y*incy))
            if left$(s$,1)="-"then
                s$=right$(s$,len(s$)-1)
                #1 "color red"
            else
                #1 "color black"
            end if
            sx=len(s$)*6
            'at the zero point draw an axis line
            if int(ymax-y*incy)>-1 and int(ymax-y*incy)<1 then
                #1 "place ";cx;" ";cy+y;" ;color yellow ; turn 90 ; go ";w
                #1 "color black"
                my=y
            end if
            #1 "place ";cx-sx-5;" ";cy+y+5;" ;\";s$
        next

        'now draw the X scale
        for x=0 to w step 20
            s$=str$(int(xmin+x*incx))
            if left$(s$,1)="-"then
                s$=right$(s$,len(s$)-1)
                #1 "color red"
            else
                #1 "color black"
            end if
            if int(xmin+x*incx)>-1 and int(xmin+x*incx)<1 then
                #1 "place ";cx+x;" ";cy+h;" ;color yellow ; north ; go ";h
                #1 "color black"
                mx=x
            end if
            for l=1 to len(s$)
                #1 "place ";cx-8+x+l*6;" ";cy+5+h+l*8;" ;\";mid$(s$,l,1)
            next
        next

        'chart the data scaled and unscaled
        'just to make the point that the data is scaled for display
        #1 "color blue"
        for n=pmin to pmax
            #1 "color blue" 'scaled
            #1 "set ";cx+points(1,n)/incx;" ";cy+points(2,n)/incy
            #1 "color red 'not scaled"
            #1 "set ";cx+points(1,n);" ";cy+points(2,n)
        next


        #1 "flush"

        end function


        [quit]

        close #1

        end
|
|
|
|
Post by tsh73 on Sept 11, 2018 5:29:02 GMT -5
I had similar thing started a while back. Long while - it was typed in summer break 2011 and abandoned as school started. It is not quite finished but still quite capable. (today) I spent some time writing "demo" code for it. Here it is - run it, press ENTER or close graph window as prompted. Probably several times  Things missing (comparing to Excel ): * no ticks on axes (left "TODO", left unrealised) * only ordinary scale (no exponential / logarithmic) * only line graphs * no second scale * no "NaN" support (magic value?) to allow empty parts of a graph * if several lines, all series have same amount of data points 'chart library kind-of-header
'(that is, should be included to top)
'====================================================
global Chart.xmin, Chart.xmax, Chart.ymin, Chart.ymax
global Chart.winW, Chart.winH
global Chart.slackX, Chart.slackY
global Chart.nPoints, Chart.nSeries, Chart.handle$
global Chart.windowTitle$
global Chart.colors$, Chart.widths$
dim Chart.data(1,1)
'-----------------------------------------------------
'include chart.hb to the top
'include chart.lb at the end
'Chart library demo code
data "Hello there"
data "This is Chart library demo code"
data "It tries to show what this library can and how to use it"
data "PAUSE"
gosub [showMsg]
data "So. This library allows to use from a mainwin programs"
data "You call a function, program opens modal window"
data "Your program blocked till your close window"
data "(so at once you can have only one chart window)"
data "(Left drag shows math coords in a textbox - you can copy and use them"
data ""
data "Now, the easiest thing:"
data "sub chartByFunc f$,xmin,xmax"
data "call chartByFunc '2*cos(x)-cos(2*x)',-3,5"
data "Of course it uses EVAL, so it needs LB"
data "(Close window to continue)"
data "NEXT"
gosub [showMsg]
call chartByFunc "2*cos(x)-cos(2*x)",-3,5
data "You can change graph color by setting Chart.colors$"
data " Chart.colors$ = 'red'"
data "NEXT"
gosub [showMsg]
Chart.colors$ = "red"
call chartByFunc "2*cos(x)-cos(2*x)",-3,5
data "You can change number of points by setting Chart.nPoints"
data "default is 300 (1000 for parametric function)"
data " Chart.nPoints = 15"
data "NEXT"
gosub [showMsg]
Chart.nPoints = 15
call chartByFunc "2*cos(x)-cos(2*x)",-3,5
data "You can change chart title by setting Chart.windowTitle$"
data " Chart.windowTitle$ = 'Chart test'"
data "NEXT"
gosub [showMsg]
Chart.nPoints = 0 'reset to default
Chart.windowTitle$ = "Chart test"
call chartByFunc "2*cos(x)-cos(2*x)",-3,5
data "You can change window size by ordinary LB means"
data "WindowWidth, WindowHeight"
data " WindowWidth = 500"
data " WindowHeight = 500"
data "(position of modal windows is tricky thing)"
data "NEXT"
gosub [showMsg]
WindowWidth = 500
WindowHeight = 500
call chartByFunc "2*cos(x)-cos(2*x)",-3,5
data "Did I said 'Parametric'?"
data " parametricChartByFunc x$,y$,tmin,tmax"
data "it uses two functions for x(parameter) and y(parameter)"
data "(sorry both functions are defined as functions of (x))"
data "NEXT"
gosub [showMsg]
call parametricChartByFunc "2*cos(x)-cos(2*x)", "2*sin(x)-sin(2*x)", 0, 6.28
data "Now, that was easy part"
data ""
data "But chartByFunc/parametricChartByFunc bas 'ByArray' counterpart"
data "Of course that means you have to fill that array"
data "BUT"
data "you can draw several lines on same chart that way"
data "PAUSE"
gosub [showMsg]
data "So for ordinary functions:"
data "set Chart.nSeries"
data "set Chart.nPoints"
data "redim Chart.data(Chart.nSeries, Chart.nPoints)"
data "fill Chart.data(,) array"
data " (col0 for X, col1 etc to Y1 etc)"
data "then call chartByArray"
data "NEXT"
gosub [showMsg]
WindowWidth = 500
WindowHeight = 300
Chart.nSeries = 3 'for ordinary graphs, that will be
'col0 for X, col1 etc to Y1 etc
Chart.colors$ = "" 'reset colors to default
Chart.nPoints = 100
redim Chart.data(Chart.nSeries, Chart.nPoints)
xmin=-2: xmax=3
Chart.xmin = xmin
Chart.xmax = xmax
for i = 1 to Chart.nPoints
x = i*(Chart.xmax-Chart.xmin)/Chart.nPoints+Chart.xmin
Chart.data(0,i)=x
Chart.data(1,i)=sin(x)
Chart.data(2,i)=2*cos(3*x)
Chart.data(3,i)=cos(1/(x+.0001))' small offset so not to divide by 0
next
call chartByArray
data "Remember Chart.colors$? "
data "You can set several colors - for different lines"
data "and even change line widths with Chart.widths$"
data " Chart.colors$ = 'pink darkgreen cyan'"
data " Chart.widths$='3 2 1'"
data "NEXT"
gosub [showMsg]
Chart.colors$ = "pink darkgreen cyan "
Chart.widths$="3 2 1"
call chartByArray
Chart.widths$="" 'reset to default
Chart.colors$ = "" 'reset to default
data "For several parametric plots:"
data "redim Chart.data(Chart.nSeries*2, Chart.nPoints)"
data "fill Chart.data(,) array"
data " (col1 for X1, col2 etc to Y1, col3 for X2, col4 etc to Y2 etc)"
data "then call parametricChartByArray"
data "NEXT"
gosub [showMsg]
Chart.nSeries = 2
Chart.nPoints = 1000 'need defined for REDIM
redim Chart.data(Chart.nSeries*2, Chart.nPoints)
for i = 1 to Chart.nPoints
t = 2*355/113 /Chart.nPoints*i
Chart.data(1,i)=sin(t)
Chart.data(2,i)=cos(t) 'first plot will be a circle
t = 3/Chart.nPoints*i
Chart.data(3,i)=t*sin(t*3)
Chart.data(4,i)=t*cos(t*3) 'second - spiral
'print i,Chart.data(0,i),Chart.data(1,i),Chart.data(2,i)
next
call parametricChartByArray
data "Last thing"
data "Functions we tried just opened dialog and waited there"
data "But there is a functions that draw graph, (FLUSH) and RETURN immediately"
data "they are ended by 'InHandle', like"
data " chartByFuncInHandle"
data " parametricChartByFuncInHandle"
data "They need graphic handle passed"
data "You will not get point tracking but you can use it in your GUI"
data "draw/redraw as needed"
data "(and may be several ones)"
data "See: we draw a graph, and after 3 sec change it to another one"
data "PAUSE"
gosub [showMsg]
'Now, just draw in a given handle
'function returns immediately
graphicbox #main.gr1 1, 1, 200, 200
button #main.btn1 "just button", [btnTest1], UL, 210, 1
open "Chart in a GUI" for window as #main
#main "trapclose [quit]"
'call chartByArrayInHandle "#main.gr1"
Chart.nPoints = 20
call parametricChartByFuncInHandle "#main.gr1", "2*cos(x)-cos(2*x)", "2*sin(x)-sin(2*x)", 0, 6.28
Chart.nPoints = 0
timer 3000, [timeUp1]
wait
[timeUp1]
timer 0
#main.gr1 "cls"
f$="1.5*x^2-2*sin(5*x)"
call chartByFuncInHandle "#main.gr1", f$,xmin,xmax
wait
[btnTest1]
notice "just button pressed"
wait
[quit]
timer 0
close #main
print "*** End of demo ***"
end
end
data ""
data ""
data ""
data ""
data "NEXT"
print
print "*** End of demo ***"
end
[showMsg]
msg$ = ""
while msg$<>"NEXT" and msg$<>"PAUSE"
read msg$
if msg$<>"NEXT" and msg$<>"PAUSE" then print repl39to34$(msg$)
wend
print
if msg$<>"NEXT" then input "(Press Enter to continue)"; dummy$
return
function repl39to34$(s$) ' (') to (")
for i = 1 to len(s$)
c$=mid$(s$,i,1)
if c$="'" then c$=chr$(34)
repl39to34$=repl39to34$+c$
next
end function
'>>include chart.lb at the end
'chart library body
'to be included after main program
'(together with header included at top)
'-----------------------------------------------------
sub parametricChartByArrayInHandle handle$
'this sub RETURNS AFTER DRAWING
Chart.handle$ = handle$
#Chart.handle$ "down"
'get a chart size
#Chart.handle$ "home"
#Chart.handle$ "posxy w h"
Chart.winW=2*w: Chart.winH=2*h
'now, to get Chart.ymin, Chart.ymax we have to loop
Chart.ymin=Chart.data(2,1)
Chart.ymax=Chart.ymin
for s = 1 to Chart.nSeries
for i = 1 to Chart.nPoints
y=Chart.data(s*2,i)
if Chart.ymin > y then Chart.ymin = y
if Chart.ymax < y then Chart.ymax = y
next
next
'for parametrics, xmax xmin should be calculated too
Chart.xmin=Chart.data(1,1)
Chart.xmax=Chart.xmin
for s = 1 to Chart.nSeries
for i = 1 to Chart.nPoints
x=Chart.data(s*2-1,i)
if Chart.xmin > x then Chart.xmin = x
if Chart.xmax < x then Chart.xmax = x
next
next
colorList$ = Chart.colors$
if colorList$="" then colorList$ = "blue green red cyan pink yellow black lightgray darkblue darkgreen darkred darkcyan darkpink brown darkgray"
'add axis
call drawAxes
call drawTicks
'and labeling
', before graphs (so then came over text)
call drawLabels
'now we just - plot function
'for parametric graphs, that will be
'col1 for X1, col2 etc to Y1, col3 for X2, col4 etc to Y2 etc
for s = 1 to Chart.nSeries
colr$=word$(colorList$, s)
if colr$="" then colr$= "black"
#Chart.handle$ "color ";colr$
if Chart.widths$<>"" then
w$ = word$(Chart.widths$, s)
if w$<>""then #Chart.handle$ "size ";w$
end if
x=Chart.data(s*2-1,1)
y=Chart.data(s*2,1)
#Chart.handle$ "set ";sx(x);" ";sy(y) 'just set first dot
for i = 1 to Chart.nPoints
x=Chart.data(s*2-1,i)
y=Chart.data(s*2,i)
#Chart.handle$ "goto ";sx(x);" ";sy(y) 'then connect dots
next
next
#Chart.handle$ "flush"
end sub
sub chartByArrayInHandle handle$
'this sub RETURNS AFTER DRAWING
Chart.handle$ = handle$
#Chart.handle$ "down"
'get a chart size
#Chart.handle$ "home"
#Chart.handle$ "posxy w h"
Chart.winW=2*w: Chart.winH=2*h
'now, to get Chart.ymin, Chart.ymax we have to loop
Chart.ymin=Chart.data(1,1)
Chart.ymax=Chart.ymin
for s = 1 to Chart.nSeries
for i = 1 to Chart.nPoints
y=Chart.data(s,i)
if Chart.ymin > y then Chart.ymin = y
if Chart.ymax < y then Chart.ymax = y
next
next
colorList$ = Chart.colors$
if colorList$="" then colorList$ = "blue green red cyan pink yellow black lightgray darkblue darkgreen darkred darkcyan darkpink brown darkgray"
'add axis
call drawAxes
call drawTicks
'and labeling
', before graphs (so then came over text)
call drawLabels
'now we just - plot function
'for ordinary graphs, that will be
'col0 for X, col1 etc to Y1 etc
for s = 1 to Chart.nSeries
colr$=word$(colorList$, s)
if colr$="" then colr$= "black"
#Chart.handle$ "color ";colr$
if Chart.widths$<>"" then
w$ = word$(Chart.widths$, s)
if w$<>""then #Chart.handle$ "size ";w$
end if
y=Chart.data(s,1)
#Chart.handle$ "set ";sx(Chart.xmin);" ";sy(y) 'just set first dot
for i = 1 to Chart.nPoints
x=Chart.data(0,i)
y=Chart.data(s,i)
#Chart.handle$ "goto ";sx(x);" ";sy(y) 'then connect dots
next
next
#Chart.handle$ "flush"
end sub
sub parametricChartByArray
'this sub OPENS MODAL WINDOW and STAYS UNTIL IT CLOSED
call genericChartByArray 1
end sub
sub chartByArray
'this sub OPENS MODAL WINDOW and STAYS UNTIL IT CLOSED
call genericChartByArray 0
end sub
sub genericChartByArray isParametric
oldWindowWidth = WindowWidth
oldWindowHeight = WindowHeight
gosub [getSlack]
WindowWidth=oldWindowWidth:WindowHeight=oldWindowHeight
textbox #chart.track, 1, 1, WindowWidth-Chart.slackX, 25
graphicbox #chart.gr, 1, 25, WindowWidth-Chart.slackX, WindowHeight-Chart.slackY-25
title$=Chart.windowTitle$
if title$="" then title$="(modal) Chart window"
open title$ for dialog_modal as #chart
#chart "trapclose [quitChart]"
#chart.track "left mouse button move for tracking"
if isParametric then
call parametricChartByArrayInHandle "#chart.gr"
else
call chartByArrayInHandle "#chart.gr"
end if
#chart.gr "when leftButtonMove [track]"
wait
[track]
#chart.track ex(MouseX); " "; ey(MouseY)
wait
[getSlack]
if Chart.slackX <>0 then return
WindowWidth=200:WindowHeight=200
open "" for graphics_nsb as #t:#t,"home;posxy x y":close#t
Chart.slackX=WindowWidth-2*x:Chart.slackY=WindowHeight-2*y
return
[quitChart]
close #chart
end sub
sub parametricChartByFunc x$,y$,tmin,tmax
'this sub OPENS MODAL WINDOW and STAYS UNTIL IT CLOSED
nPointsWasEmpty = (Chart.nPoints=0)
if nPointsWasEmpty then Chart.nPoints=1000 'default
call fillArrForParametricFunc x$,y$,tmin,tmax
call parametricChartByArray
if nPointsWasEmpty then Chart.nPoints=0 'reset
end sub
sub parametricChartByFuncInHandle handle$, x$,y$,tmin,tmax
'this sub RETURNS AFTER DRAWING
nPointsWasEmpty = (Chart.nPoints=0)
if nPointsWasEmpty then Chart.nPoints=1000 'default
call fillArrForParametricFunc x$,y$,tmin,tmax
call parametricChartByArrayInHandle handle$
if nPointsWasEmpty then Chart.nPoints=0 'reset
end sub
sub chartByFunc f$,xmin,xmax
'this sub OPENS MODAL WINDOW and STAYS UNTIL IT CLOSED
nPointsWasEmpty = (Chart.nPoints=0)
if nPointsWasEmpty then Chart.nPoints=300 'default
call fillArrForFunc f$,xmin,xmax
call chartByArray
if nPointsWasEmpty then Chart.nPoints=0 'reset
end sub
sub chartByFuncInHandle handle$, f$,xmin,xmax
'this sub RETURNS AFTER DRAWING
nPointsWasEmpty = (Chart.nPoints=0)
if nPointsWasEmpty then Chart.nPoints=300 'default
call fillArrForFunc f$,xmin,xmax
call chartByArrayInHandle handle$
if nPointsWasEmpty then Chart.nPoints=0 'reset
end sub
sub fillArrForFunc f$,xmin,xmax
'copy to globals first
Chart.xmin = xmin
Chart.xmax = xmax
'reality/default check
if Chart.xmin=Chart.xmax then
Chart.xmin = Chart.xmin-10
Chart.xmax = Chart.xmax+10
end if
Chart.nSeries = 1 'for ordinary graphs, that will be
'col0 for X, col1 etc to Y1 etc
redim Chart.data(Chart.nSeries, Chart.nPoints)
for i = 1 to Chart.nPoints
x = i*(Chart.xmax-Chart.xmin)/Chart.nPoints+Chart.xmin
Chart.data(0,i)=x
Chart.data(1,i)=evalFuncX(f$,x)
next
end sub
sub fillArrForParametricFunc x$,y$,tmin,tmax
'reality/default check
if tmin=tmax then
tmin = tmin-10
tmax = tmax+10
end if
Chart.nSeries = 1 'for parametric graphs, that will be
'col1 for X1, col2 etc to Y1, col3 for X2, col4 etc to Y2 etc
redim Chart.data(Chart.nSeries*2, Chart.nPoints)
for i = 1 to Chart.nPoints
t = i*(tmax-tmin)/Chart.nPoints+tmin
Chart.data(1,i)=evalFuncX(x$,t)
Chart.data(2,i)=evalFuncX(y$,t)
next
end sub
'-----------------------------------------------------
'function f(x) evaluation
function evalFuncX(f$,x)
'for LB apparently
'evalFuncX = eval(f$)
'exit function
'now, for lowly JB
select case f$
case "1.5*x^2-2*sin(5*x)" 'single function testing
evalFuncX = 1.5*x^2-2*sin(5*x)
case "2*cos(x)-cos(2*x)" 'parametric, cardioid X of x[0..2pi]
evalFuncX = 2*cos(x)-cos(2*x)
case "2*sin(x)-sin(2*x)" 'parametric, cardioid Y of x[0..2pi]
evalFuncX = 2*sin(x)-sin(2*x)
case else
evalFuncX = x 'so you clearly see it works, and works wrong
end select
end function
'To translate X from interval [a,b] to [c,d] we'll do (X-a)/(b-a)*(d-c)+c.
'create two functions: sx(x) and sy(y)
function sx(x)
sx=(x-Chart.xmin)/(Chart.xmax-Chart.xmin)*Chart.winW
end function
function sy(y)
sy=Chart.winH-(y-Chart.ymin)/(Chart.ymax-Chart.ymin)*Chart.winH 'Y is inverted, so Chart.winH-...
end function
'now, two back functions for mouse tracking
function ex(x)
ex=(x-0)/Chart.winW*(Chart.xmax-Chart.xmin)+Chart.xmin
end function
function ey(y)
ey=Chart.ymin-(y-Chart.winH)/Chart.winH*(Chart.ymax-Chart.ymin) 'Y is inverted, so Chart.winH-...
end function
'-----------------------------------------------------
sub drawAxes
#Chart.handle$ "color black"
#Chart.handle$ "size 1"
#Chart.handle$ "line ";sx(Chart.xmin);" ";sy(0);" ";sx(Chart.xmax);" ";sy(0)
#Chart.handle$ "line ";sx(0);" ";sy(Chart.ymin);" ";sx(0);" ";sy(Chart.ymax)
end sub
sub drawLabels
'default: numbers 7x16 pixels
CharW=7
CharH=16
call textAt sx(0)+5,sy(0)-5,"0,0"
call textAt sx(Chart.xmax)-20,sy(0)-5,"X"
call textAt sx(0)+5,sy(Chart.ymax)+20,"Y"
call numAt sx(Chart.xmin)+20,sy(Chart.ymin)-5,Chart.xmin
call numRightAt sx(Chart.xmax),sy(Chart.ymin)-5,Chart.xmax
call numAt sx(Chart.xmin),sy(Chart.ymin)-20,Chart.ymin
call numAt sx(Chart.xmin),sy(Chart.ymax)+15,Chart.ymax
end sub
sub drawTicks
'tbd
end sub
'-----------------------------------------------------
sub textAt x,y,text$
#Chart.handle$ "place ";x;" ";y
#Chart.handle$ "\";text$
end sub
sub numAt x,y,n
text$ = formatG$(n,1)
call textAt x,y,text$
end sub
sub numRightAt x,y,n
'default: numbers 7x16 pixels
CharW=7
text$ = formatG$(n,1)
call textAt x-len(text$)*CharW,y,text$
end sub
'-----------------------------------------------------
'scientific USING function.
'(keep in mind that there are no more then 16 digits stored in real number (Double data type)).
function usingS$(n,prec)
if n = 0 then usingS$="0e+0":exit function
fmt$ = "#"+left$(".",prec>0)+left$("#################",prec) 'fmt of mantissa
s$=left$("-",n<0)
n=abs(n)
log10=log(n)/log(10)
e=int(log10)-(log10<0) 'QB like INT. Makes mantissa for negative exponents start from digit (not 0 as JB do)
p=10^e
if left$(using(fmt$,n/p),1)="%" then p=p*10:e = e+1
usingS$=s$+using(fmt$,n/p) +"e"+left$("+",e>0) +str$(e) 'Excel always shows "+" for exponent
end function
'there 'scientific' just not needed?
function formatG$(n,prec)
a$=usingS$(n,prec)
fmt$ = "#"+left$(".",prec>0)+left$("#################",prec) 'fmt of mantissa
b$=using(fmt$,n)
if left$(b$,1)="%" then b$=mid$(b$,2)
formatG$=a$
if len(b$)<len(a$) _ 'nice try but 1e-3 turns to 0.000 with prec=3 - ??
and abs(n)>1 then formatG$=b$
end function
|
|
|
|
Post by tenochtitlanuk on Oct 10, 2021 3:56:56 GMT -5
Excuse the necroposting on an old thread! Anatoly's demo is a really good example of what can be done to produce display graphics. The code below uses the opposite approach- install and call GnuPlot from LB. Very short! You then have options like testing WITHOUT LB in the GnuPlot window; saving as Postscript or w.h.y. etc. Trumped by LB for the total versatility that coding in LB allows, but fast and easy, and GnuPlot has good documentation online. I work entirely on LB under Wine/Linux- perhaps because of this some of the axis titles etc are a bit displaced. 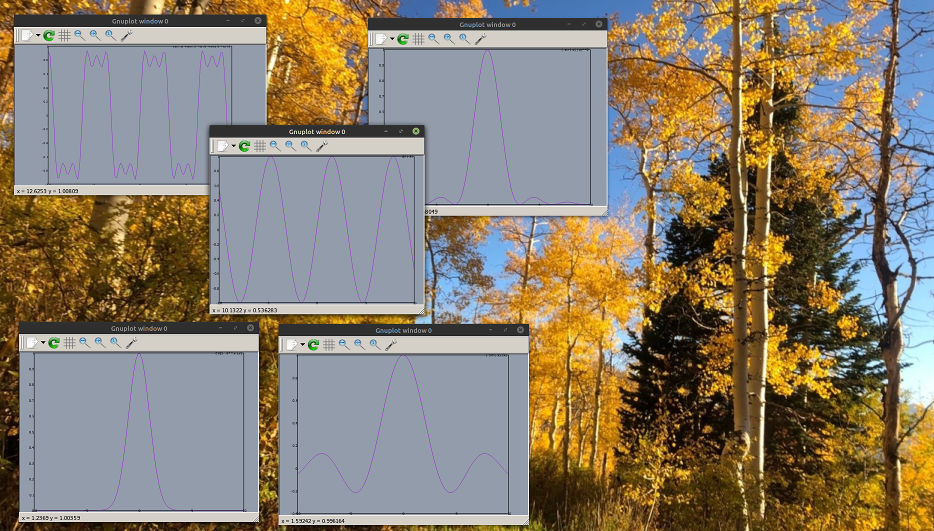
    nomainwin

    exe$ ="C:\Program Files\gnuplot\bin\gnuplot.exe"

    'run exe$ +" set sample 200"            '   these get reset?? or ignored????
    'run exe$ +" set size square 0.8,0.9"

    do while func$ <>"999"
        read func$
        c$      =" -persist -e "; chr$( 34); " plot [-10.0:20.00] "; func$; chr$( 34)
        if func$ <>"999" then run exe$ +c$
    loop

    run exe$ +" -persist -e "; chr$( 34); " splot x**2 +y**2"; chr$( 34)

    end

    data "x"
    data "x**2"
    data "sin( x)"
    data "x *sin( x)"
    data "( sin( x) /x))2"
    data "exp( -x**2 /2)"
    data "( sin( x) /x)**2"
    data "sin( x) +sin( 3 *x) /3 +sin( 5 *x) /5)"
    data "sin( x) +0.2 *sin( 4 *x)"

    data "999"
|
|
|
|
Post by jayesjay on Nov 1, 2021 12:41:02 GMT -5
It is many years since I last used LB, but having just reinstalled it, I have to ask what I asked many years ago - "Is there a chart (i.e. graph) plot function?"
The last time there was none, but reading this page, I can see that there are several ways of doing it now.
I would be pleased if someone could point me to a simple technique for drawing graphs. That is - data plots, not squiggles!
I had written code to make a general plot area. It features:
optional axis scaling, ticks, titles and drawing error blocking.
It has a subroutine area to develop the plot data, and with a bit of effort, other functions could be plotted here.
The current version is set up with a filter response - the first few cycles of a tone (f1) applied to a circuit (tuned to f2), where the relative amplitudes and f1, f2 can be changed via dialogue boxes.
Would anyone be interested if I posted the code file?.
|
|


